


Stress-strain curves are widely used in material testing because they show how a material responds as load increases. A single curve can reveal stiffness, yield behavior, tensile strength, ductility, and the way a material approaches failure.
The curve is generated during a tensile test. A specimen is pulled while the test system records force and elongation, which are then converted into stress and strain. The resulting curve shows where deformation remains elastic, where permanent deformation begins, and how the material behaves before fracture.
Real test curves are not always smooth or easy to interpret. Some materials show a distinct yield point, while others transition gradually into plastic deformation. These differences matter when comparing test results or deciding whether a material’s measured behavior matches the demands of a part.
1. What Is a Stress-Strain Curve?
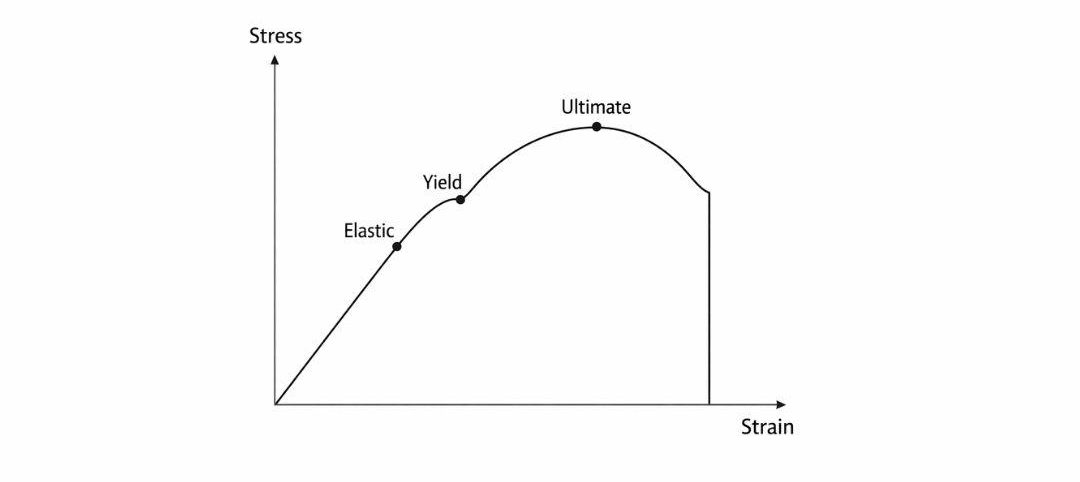
A stress-strain curve shows how a material deforms as tensile load increases. It is generated from a tensile test by converting the measured force and elongation into stress and strain.
Engineering stress is the applied force divided by the specimen’s original cross-sectional area. Engineering strain is the change in gauge length divided by the original gauge length. Because both values are normalized to the original specimen dimensions, results from different specimen sizes can be compared more meaningfully.
The shape of the curve reveals different aspects of material behavior. The initial slope reflects stiffness, the transition into plastic deformation indicates yielding, and the amount of strain before fracture provides information about ductility. The peak and final portion of the curve also show how the material behaves as it approaches failure.
2. Key Regions of the Stress-Strain Curve
Different regions of a stress-strain curve represent different stages of material deformation, from recoverable elastic strain to permanent deformation and eventual fracture.
Elastic Region
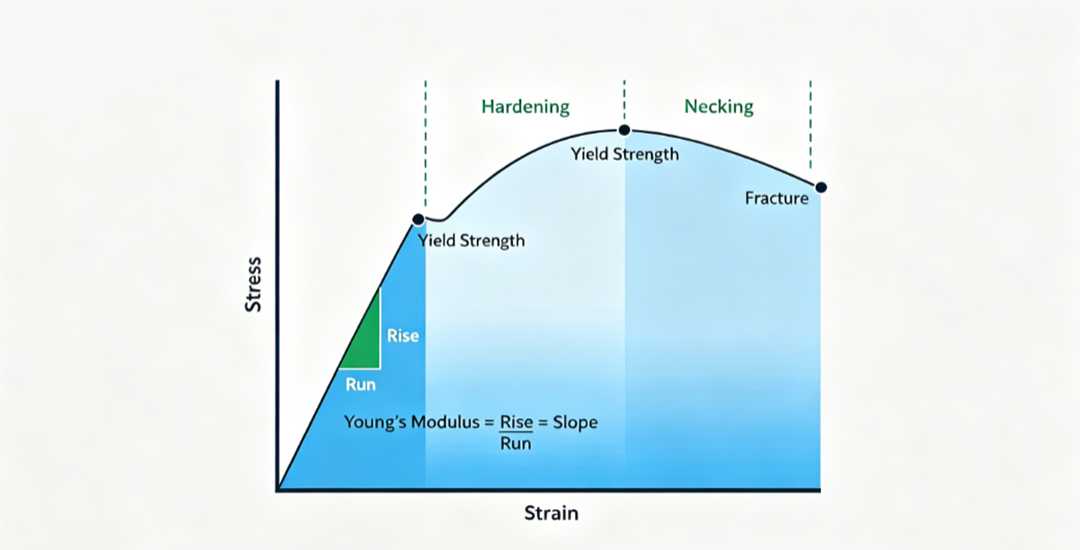
At the beginning of the curve, stress and strain increase approximately in proportion within the linear elastic region. If the load is removed here, the material returns to its original dimensions without permanent deformation.
The slope of this linear portion is the elastic modulus, or Young’s modulus. A higher modulus indicates a stiffer material and less elastic strain under the same applied stress.
Yielding
Yielding marks the transition from primarily elastic behavior to permanent plastic deformation. Some materials, such as certain low-carbon steels, show a distinct yield point, while others transition more gradually.
For materials without a clear yield point, yield strength is commonly determined using the 0.2% offset method. Once plastic deformation has occurred, unloading leaves some permanent strain in the specimen.
Plastic Region and Ultimate Tensile Strength
Beyond yield, the material continues to deform plastically. Many ductile metals also undergo strain hardening, which increases the stress required for further deformation.
On an engineering stress-strain curve, the stress eventually reaches a maximum value known as the ultimate tensile strength (UTS). This is the highest engineering stress recorded during the tensile test.
Necking and Fracture
After the UTS is reached, localized thinning known as necking develops in ductile tensile specimens. The load carried by the specimen begins to decrease as deformation becomes concentrated in the necked region.
Because engineering stress is calculated using the original cross-sectional area, the engineering stress curve drops after UTS. The specimen continues to deform until fracture, and the strain at fracture provides information about its ductility.
3. Key Mechanical Properties from a Stress-Strain Curve
Five mechanical properties are commonly taken from a tensile stress-strain curve, each describing a different aspect of material behavior.
| נֶכֶס | Where to Find It | Engineering Meaning |
| Elastic Modulus | Slope of the linear elastic region | Measures stiffness. A higher modulus means less elastic strain under the same stress. |
| חוזק תשואה | Yield point or specified offset stress | Indicates the onset of permanent plastic deformation. |
| Ultimate Tensile Strength (UTS) | Highest engineering stress on the curve | Maximum engineering stress reached during the tensile test. |
| Elongation at Break | Strain at fracture | Indicates ductility and how much deformation occurs before fracture. |
| קְשִׁיחוּת | Area under the stress-strain curve to fracture | Represents the energy absorbed per unit volume before fracture. |
Some materials do not show a distinct yield point. In these cases, a 0.2% offset method is commonly used to define yield strength or proof stress.
For components intended to remain elastic in service, yield strength is often more relevant than UTS. UTS describes the peak engineering stress reached in the tensile test, while elongation and toughness provide additional information about how much deformation and energy absorption occur before fracture.
4. Engineering Stress-Strain vs. True Stress-Strain
Stress-strain data can be expressed in two common ways: engineering stress-strain and true stress-strain. They are similar at small strains but differ increasingly as plastic deformation becomes larger.
Engineering Stress-Strain
Engineering stress is calculated using the specimen’s original cross-sectional area, while engineering strain uses the original gauge length as the reference.
The calculation, therefore, does not account for the reduction in cross-sectional area that occurs as the specimen stretches. Engineering stress-strain is the form most commonly reported in standard tensile-test data and material property sheets.
True Stress-Strain
True stress uses the instantaneous cross-sectional area of the specimen rather than the original area. True strain also accounts for deformation incrementally as the specimen length changes.
As deformation increases and the specimen becomes thinner, the difference between engineering and true stress becomes more significant.
The Practical Difference
At small strains, engineering and true stress-strain values are very close. As plastic deformation increases, the two curves gradually separate.
After the engineering curve reaches UTS and necking begins, engineering stress falls because the tensile load decreases while stress is still calculated using the original area. True local stress may continue to increase because the cross-sectional area in the neck decreases rapidly.
Once necking becomes localized, however, deformation is no longer uniform, so simple conversions between engineering and true stress-strain are no longer sufficient for accurate material characterization.
When the Difference Matters
For many calculations that remain within the elastic range, engineering stress-strain data is sufficient. Properties such as elastic modulus and conventional yield strength are commonly obtained from the engineering curve.
True stress-strain data becomes more important for processes involving substantial plastic deformation, such as deep drawing, forging, stamping, and other metal-forming operations.
For nonlinear plasticity simulations, FEA material models also commonly use true stress and corresponding plastic strain data. Using inappropriate material data can affect predictions of forming loads, plastic deformation, and springback.
5. Types of Stress-Strain Curves for Different Materials
Different materials can produce very different stress-strain curves. The curve shape reflects characteristics such as stiffness, yielding behavior, plastic deformation, ductility, and fracture, although the exact response also depends on material grade, processing condition, temperature, and test conditions.
| Material Behavior | Typical Curve Characteristics | What It Indicates | Common Examples |
| Ductile metals with distinct yielding | Linear elastic region followed by noticeable yielding, plastic deformation, and necking | Significant plastic deformation before fracture | Some low-carbon steels |
| Ductile metals with gradual yielding | Smooth transition from elastic to plastic deformation without a sharp yield point | Yield strength may require an offset method; substantial plastic deformation can still occur | Aluminum alloys, copper, many stainless steels |
| Brittle materials | Relatively little plastic strain before fracture | Limited ductility and less visible deformation before tensile failure | Cast iron, ceramics |
| Elastomers | Strongly nonlinear curve with very large recoverable strain | Low modulus and very high elastic deformation compared with metals | Rubber and other elastomers |
The main distinction is how much deformation occurs before fracture and whether yielding is gradual or clearly defined. Ductile metals can undergo significant plastic deformation, while brittle materials fracture with comparatively little plastic strain. Elastomers behave differently again, showing large nonlinear elastic strains that are not well described by the typical metal stress-strain curve.
6. Factors That Affect the Stress-Strain Curve
The same material can produce different stress-strain curves under different test and material conditions. Loading rate, temperature, and heat-treatment condition can all change the measured strength, ductility, and yielding behavior.
Loading Rate
The rate of deformation can influence the measured stress-strain response. Changes in strain rate may affect yield strength, tensile strength, elongation, and fracture behavior, although the effect depends on the material and test conditions.
For components exposed to impact or rapid loading, standard quasi-static tensile data may not fully represent the material behavior at the actual loading rate.
טֶמפֶּרָטוּרָה
Temperature can significantly change a material’s stress-strain response. Yield strength, חוזק מתיחה, elongation, and fracture behavior may all shift as the test temperature changes.
For applications operating well above or below room temperature, material data measured at the relevant service temperature is more useful than relying only on room-temperature tensile results.
טיפול בחום
Heat treatment can produce very different stress-strain curves for the same alloy. Annealing, quenching and tempering, and precipitation hardening can change strength, ductility, hardness, and the shape of the plastic region.
The material condition shown on a test report should therefore match the condition of the actual part. Stress-strain data for an annealed material should not be assumed to represent the same alloy after hardening or other טיפול בחום.
7. Using the Stress-Strain Curve for Material Selection
A stress-strain curve becomes most useful when its mechanical properties are considered together with the part’s actual function. Different applications place different priorities on strength, ductility, toughness, and plastic deformation behavior.
Strength vs. Toughness
High strength is important when a component must resist permanent deformation under load, while toughness becomes more important when the part must absorb energy before fracture.
These requirements do not always point to the same material. A material with high yield strength may resist deformation well but offer limited ductility, while a tougher material may absorb more energy through plastic deformation. The appropriate balance depends on the loading condition and the way the component is expected to fail.
Ductility and Formability
Elongation and the extent of the plastic region provide useful indications of ductility. For bending, stamping, and deep drawing, greater ductility generally allows more deformation before cracking.
Formability cannot be judged from elongation alone, however. Material condition, strain-hardening behavior, geometry, thickness, and forming method also affect the result.
For machined parts, ductility still influences chip formation, burr formation, and cutting behavior, although it may be less critical than in forming operations.
Work Hardening and Plastic Deformation
A rising stress level after yielding indicates strain-hardening behavior, where additional plastic deformation requires increasing stress.
This behavior is important in forming because it can help distribute deformation and delay localized thinning in some materials. It is also relevant when developing material models for processes involving substantial plastic deformation.
מַסְקָנָה
A stress-strain curve shows more than how much load a material can withstand. Its slope, yield behavior, plastic deformation, ultimate tensile strength, and fracture strain together reveal how the material responds from initial loading to failure.
The curve is most useful when it is interpreted in the correct context. Material condition, temperature, loading rate, and test method can all change the measured response, so two curves should only be compared when their test conditions are relevant to the intended application.
In practice, the stress-strain curve provides a clear way to compare stiffness, strength, ductility, and deformation behavior, but these properties should still be considered alongside the actual loading and service requirements of the part.
 Hebrew
 English
 Turkish
 French
 Russian
 German
 Spanish
 Portuguese